下载并改变执行权限:
wget http://www.day32.com/mysql/tuning-primer.sh
chmod +x tuning-primer.sh
./tuning-primer.sh
结果报告:
会用几种颜色标记:
蓝色:总指标
绿色:表示此参数还可以
红色:表示此参数有严重问题
深红色:表示有问题参数
黄色:一些信息提示
而且还有警告:
note! this script will still suggest raising the join_buffer_size when
any joins not using indexes are found.
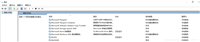
下面是一个报告的结果
xx@xxxxxx:~$ . ./tuning-primer.sh
mysqld is alive
-- mysql performance tuning primer --
- by: matthew montgomery -
mysql version 5.1.32-enterprise-gpl-log x86_64
uptime = 4 days 0 hrs 48 min 3 sec
avg. qps = 255
total questions = 88956118
threads connected = 4
server has been running for over 48hrs.
it should be safe to follow these recommendations
to find out more information on how each of these
runtime variables effects performance visit:
http://dev.mysql.com/doc/refman/5.1/en/server-system-variables.html
visit http://www.mysql.com/products/enterprise/advisors.html
for info about mysql's enterprise monitoring and advisory service
slow queries
the slow query log is not enabled.
current long_query_time = 10.000000 sec.
you have 9589 out of 88956228 that take longer than 10.000000 sec. to complete
your long_query_time seems to be fine
binary update log
the binary update log is enabled
the expire_logs_days is not set.
the mysqld will retain the entire binary log until reset master or purge master logs commands are run manually
setting expire_logs_days will allow you to remove old binary logs automatically
see http://dev.mysql.com/doc/refman/5.1/en/purge-master-logs.html
worker threads
current thread_cache_size = 32
current threads_cached = 29
current threads_per_sec = 0
historic threads_per_sec = 0
your thread_cache_size is fine
max connections
current max_connections = 151
current threads_connected = 4
historic max_used_connections = 84
the number of used connections is 55% of the configured maximum.
your max_connections variable seems to be fine.
memory usage
max memory ever allocated : 11.87 g
configured max per-thread buffers : 10.38 g
configured max global buffers : 6.10 g
configured max memory limit : 16.48 g
physical memory : 8.00 g
max memory limit exceeds 90% of physical memory
(内存设置严重有问题!--by me)
key buffer
1714734 * 1024 / 2147483648 * 100
current myisam index space = 8 k
current key_buffer_size = 2.00 g
key cache miss rate is 1 : 585673
key buffer free ratio = 0 %
your key_buffer_size seems to be too high.
perhaps you can use these resources elsewhere
(错误参数设置:query_cache_size > query_cache_limit --by me)
sort operations
current sort_buffer_size = 4 m
current read_rnd_buffer_size = 64 m
sort buffer seems to be fine
joins
current join_buffer_size = 132.00 k
you have had 1 queries where a join could not use an index properly
you should enable "log-queries-not-using-indexes"
then look for non indexed joins in the slow query log.
if you are unable to optimize your queries you may want to increase your
join_buffer_size to accommodate larger joins in one pass.
note! this script will still suggest raising the join_buffer_size when
any joins not using indexes are found.
( join_buffer_size设置过小,另外存在一个查询使用了join但是没有走索引 --by me)
open files limit
current open_files_limit = 1185 files
the open_files_limit should typically be set to at least 2x-3x
that of table_cache if you have heavy myisam usage.
your open_files_limit value seems to be fine
table cache
current table_open_cache = 512 tables
current table_definition_cache = 256 tables
you have a total of 0 tables
you have 125 open tables.
table scanscurrent read_buffer_size = 2 m
current table scan ratio = 4650 : 1
you have a high ratio of sequential access requests to selects
you may benefit from raising read_buffer_size and/or improving your use of indexes.
table locking
current lock wait ratio = 1 : 5833374
your table locking seems to be fine
如对本文有疑问,请在下面进行留言讨论,广大热心网友会与你互动!! 点击进行留言回复

小白安装登录mysql-8.0.19-winx64的教程图解(新手必看)
Navicat连接MySQL时报10060、1045错误及my.ini位置问题


网友评论