首先在需要监控的windows机器上安装wmi_exporter。wmi_exporter下载地址:

下载后,双击即可完成安装。
完成安装后,会自动创建一个开机自启的服务


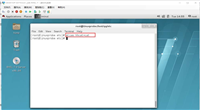
验证服务是否启动,默认wmi-exporter端口为9182
浏览器访问 (windows系统ip地址:9182端口),显示数据,则服务开启成功。

进入prometheus的安装文件夹,打开prometheus配置文件
#  cd /usr/local/prometheus
#  vim prometheus.yml
在scrape_configs标签下,添加以下内容,配置监控
- job_name: 'windows'
    static_configs:
    - targets: ['192.168.56.1:9182']
      labels:
        instance: windows
以下是prometheus.yml 文件全部内容
# my global config
global:
  scrape_interval:     15s # set the scrape interval to every 15 seconds. default is every 1 minute.
  evaluation_interval: 15s # evaluate rules every 15 seconds. the default is every 1 minute.
  # scrape_timeout is set to the global default (10s).

# alertmanager configuration
alerting:
  alertmanagers:
  - static_configs:
    - targets:
      # - alertmanager:9093

# load rules once and periodically evaluate them according to the global 'evaluation_interval'.
rule_files:
  # - "first_rules.yml"
  # - "second_rules.yml"

# a scrape configuration containing exactly one endpoint to scrape:
# here it's prometheus itself.
scrape_configs:
  # the job name is added as a label `job=<job_name>` to any timeseries scraped from this config.
  - job_name: 'prometheus'

    # metrics_path defaults to '/metrics'
    # scheme defaults to 'http'.

    static_configs:
    - targets: ['localhost:9090']

  - job_name: 'linux'
    static_configs:
    - targets: ['192.168.56.201:9100']
      labels:
        instance: linux

  - job_name: 'windows'
    static_configs:
    - targets: ['192.168.56.1:9182']
      labels:
        instance: windows
保存退出,重启prometheus服务
# systemctl restart prometheus
浏览器访问 查看监控信息

可以看到,windows机器已经加入进来。
添加dashboard
grafana官方为我们提供了很多dashboard页面,可直接下载使用。浏览器访问 下载所需要的dashboard页面
此处我们使用windows 监控的dashboard,dashboard id为:10467

然后打开我们的grafana监控页面,打开dashboard的管理页面

点击【import】按钮

然后将我们刚才的dashboard id (10467) 复制进去

grafana会自动识别dashboard id 。
然后点击【change】按钮,生成一个随机的uid,然后点击下方输入框,选择我们之前创建的数据源prometheus,最后点击【import】按钮,即可完成导入。

导入成功后,会自动打开该dashboard,即可看到我们刚才设置好的windows监控

至此prometheus监控windows机器,配置完成。
如对本文有疑问, 点击进行留言回复!!

linux下文本编辑器vim的使用方法(复制、粘贴、替换、行号、撤销、多文件操作)


网友评论