
界面代码:
object form1: tform1
  left = 252
  top = 190
  width = 1149
  height = 549
  caption = 'form1'
  color = clbtnface
  font.charset = gb2312_charset
  font.color = clwindowtext
  font.height = -13
  font.name = '宋体'
  font.style = []
  oldcreateorder = false
  oncreate = formcreate
  pixelsperinch = 96
  textheight = 13
  object chart1: tchart
    left = 0
    top = 0
    width = 472
    height = 426
    bottomwall.gradient.endcolor = 14285190
    bottomwall.gradient.midcolor = clsilver
    bottomwall.gradient.startcolor = 1415426
    bottomwall.gradient.visible = true
    gradient.endcolor = 14285190
    gradient.midcolor = clsilver
    gradient.startcolor = 1415426
    gradient.visible = true
    leftwall.gradient.endcolor = 14285190
    leftwall.gradient.midcolor = clsilver
    leftwall.gradient.startcolor = 1415426
    leftwall.gradient.visible = true
    legend.checkboxes = true
    legend.visible = false
    title.text.strings = (
      '光标同步演示')
    chart3dpercent = 45
    align = alleft
    bevelinner = bvlowered
    bevelwidth = 2
    taborder = 0
    onmousemove = chart1mousemove
    object series1: tlineseries
      cursor = crhandpoint
      marks.callout.brush.color = clblack
      marks.callout.length = 20
      marks.visible = false
      percentformat = '##0,## %'
      linepen.color = clred
      linepen.width = 2
      pointer.inflatemargins = true
      pointer.style = psrectangle
      pointer.visible = false
      xvalues.name = 'x'
      xvalues.order = loascending
      yvalues.name = 'y'
      yvalues.order = lonone
    end
    object series2: tlineseries
      active = false
      marks.callout.brush.color = clblack
      marks.visible = false
      linepen.color = clgreen
      linepen.width = 2
      pointer.inflatemargins = true
      pointer.style = psrectangle
      pointer.visible = false
      xvalues.name = 'x'
      xvalues.order = loascending
      yvalues.name = 'y'
      yvalues.order = lonone
    end
    object charttool1: tcursortool
      followmouse = true
      pen.width = 2
      series = series1
      onchange = charttool1change
    end
    object charttool2: tdragpointtool
      series = series1
      ondragpoint = charttool2dragpoint
    end
    object charttool5: tdragmarkstool
    end
    object charttool8: tmarkstiptool
      mousedelay = 250
    end
    object charttool9: textralegendtool
      legend.customposition = true
      legend.left = 0
      legend.legendstyle = lsvalues
      legend.top = 0
      series = series1
    end
    object charttool12: tnearesttool
      brush.color = clwhite
      brush.style = bsclear
      pen.color = clwhite
      pen.style = psdot
      series = series1
    end
  end
  object panel1: tpanel
    left = 0
    top = 426
    width = 1141
    height = 86
    align = albottom
    bevelinner = bvlowered
    taborder = 1
    object button5: tbutton
      left = 749
      top = 14
      width = 81
      height = 55
      caption = '&e.退出'
      taborder = 0
      onclick = button5click
    end
    object groupbox1: tgroupbox
      left = 16
      top = 8
      width = 721
      height = 65
      taborder = 1
      object checkbox11: tcheckbox
        left = 16
        top = 16
        width = 73
        height = 17
        caption = '光标工具'
        taborder = 0
        onclick = checkbox11click
      end
      object checkbox12: tcheckbox
        left = 16
        top = 40
        width = 73
        height = 17
        caption = '拖点工具'
        taborder = 1
        onclick = checkbox12click
      end
      object checkbox2: tcheckbox
        left = 416
        top = 24
        width = 41
        height = 17
        caption = '3d'
        checked = true
        state = cbchecked
        taborder = 2
        onclick = checkbox2click
      end
      object checkbox13: tcheckbox
        left = 128
        top = 16
        width = 105
        height = 17
        caption = '拖标签工具'
        taborder = 3
        onclick = checkbox13click
      end
      object checkbox14: tcheckbox
        left = 128
        top = 40
        width = 105
        height = 17
        caption = '提示签工具'
        taborder = 4
        onclick = checkbox14click
      end
      object checkbox15: tcheckbox
        left = 256
        top = 16
        width = 97
        height = 17
        caption = '附加图例工具'
        taborder = 5
        onclick = checkbox15click
      end
      object checkbox16: tcheckbox
        left = 256
        top = 39
        width = 97
        height = 17
        caption = '最近点工具'
        taborder = 6
        onclick = checkbox16click
      end
    end
  end
  object pagecontrol1: tpagecontrol
    left = 944
    top = 0
    width = 197
    height = 426
    activepage = tabsheet6
    align = alclient
    multiline = true
    taborder = 2
    object tabsheet1: ttabsheet
      caption = '光标工具'
      object groupbox2: tgroupbox
        left = 8
        top = 0
        width = 169
        height = 225
        taborder = 0
        object label1: tlabel
          left = 2
          top = 200
          width = 165
          height = 23
          align = albottom
          alignment = tacenter
          autosize = false
          color = clinfobk
          font.charset = default_charset
          font.color = clmaroon
          font.height = -16
          font.name = 'ms sans serif'
          font.style = [fsitalic]
          parentcolor = false
          parentfont = false
        end
        object button1: tbutton
          left = 33
          top = 50
          width = 49
          height = 25
          caption = '左←'
          taborder = 0
          onclick = button1click
        end
        object button2: tbutton
          left = 89
          top = 50
          width = 49
          height = 25
          caption = '右→'
          taborder = 1
          onclick = button2click
        end
        object button3: tbutton
          left = 60
          top = 18
          width = 49
          height = 25
          caption = '上↑'
          taborder = 2
          onclick = button3click
        end
        object button4: tbutton
          left = 60
          top = 80
          width = 49
          height = 25
          caption = '下↓'
          taborder = 3
          onclick = button4click
        end
        object checkbox1: tcheckbox
          left = 61
          top = 120
          width = 57
          height = 17
          caption = '同步'
          checked = true
          state = cbchecked
          taborder = 4
          onclick = checkbox1click
        end
        object checkbox5: tcheckbox
          left = 61
          top = 144
          width = 81
          height = 22
          caption = '鼠标跟随'
          checked = true
          state = cbchecked
          taborder = 5
          onclick = checkbox5click
        end
      end
    end
    object tabsheet2: ttabsheet
      caption = '拖点工具'
      imageindex = 1
      object groupbox3: tgroupbox
        left = 16
        top = 8
        width = 161
        height = 241
        taborder = 0
        object label2: tlabel
          left = 13
          top = 12
          width = 39
          height = 13
          caption = '风格:'
        end
        object combobox1: tcombobox
          left = 13
          top = 31
          width = 129
          height = 21
          itemheight = 13
          itemindex = 1
          taborder = 0
          text = 'y only'
          onchange = combobox1change
          items.strings = (
            'x only'
            'y only'
            'x and y')
        end
        object chartgrid1: tchartgrid
          left = 12
          top = 64
          width = 136
          height = 161
          options = [govertline, gohorzline, gorangeselect, godrawfocusselected, gorowsizing, gocolsizing, goediting, gotabs, gothumbtracking]
          taborder = 1
          chart = chart1
        end
      end
    end
    object tabsheet3: ttabsheet
      caption = '拖标签工具'
      imageindex = 2
      object groupbox4: tgroupbox
        left = 16
        top = 8
        width = 160
        height = 225
        taborder = 0
        object checkbox3: tcheckbox
          left = 48
          top = 48
          width = 65
          height = 17
          caption = '标签'
          checked = true
          state = cbchecked
          taborder = 0
          onclick = checkbox3click
        end
      end
    end
    object tabsheet4: ttabsheet
      caption = '提示签工具'
      imageindex = 3
      object groupbox5: tgroupbox
        left = 16
        top = 8
        width = 153
        height = 209
        taborder = 0
        object label3: tlabel
          left = 16
          top = 92
          width = 79
          height = 13
          caption = '延迟(ms):'
        end
        object label4: tlabel
          left = 16
          top = 148
          width = 65
          height = 13
          caption = '提示风格:'
        end
        object radiogroup1: tradiogroup
          left = 16
          top = 16
          width = 113
          height = 65
          caption = '在下列情形提示'
          itemindex = 0
          items.strings = (
            '移动时'
            '点击时')
          taborder = 0
          onclick = radiogroup1click
        end
        object spinedit1: tspinedit
          left = 16
          top = 112
          width = 113
          height = 22
          maxvalue = 0
          minvalue = 0
          taborder = 1
          value = 10
          onchange = spinedit1change
        end
        object combobox2: tcombobox
          left = 16
          top = 176
          width = 113
          height = 21
          itemheight = 13
          itemindex = 0
          taborder = 2
          text = 'value          { 1234 }'
          onchange = combobox2change
          items.strings = (
            'value          { 1234 }'
            'percent,       { 12 % }'
            'label,         { cars }'
            'labelpercent,  { cars 12 % }'
            'labelvalue,    { cars 1234 }'
            'legend,        { (legend.style) }'
            'percenttotal,  { 12 % of 1234 }'
            'xvalue,        { 1..2..3.. or 21/6/1996 }'
            'xy             { 123 456 }')
        end
      end
    end
    object tabsheet5: ttabsheet
      caption = '附加图例工具'
      imageindex = 4
      object groupbox6: tgroupbox
        left = 16
        top = 8
        width = 161
        height = 201
        taborder = 0
        object checkbox4: tcheckbox
          left = 48
          top = 104
          width = 57
          height = 17
          caption = '图例'
          taborder = 0
          onclick = checkbox4click
        end
      end
    end
    object tabsheet6: ttabsheet
      caption = '最近点工具'
      imageindex = 5
      object groupbox7: tgroupbox
        left = 17
        top = 16
        width = 152
        height = 201
        taborder = 0
        object label5: tlabel
          left = 16
          top = 16
          width = 39
          height = 13
          caption = '风格:'
        end
        object combobox3: tcombobox
          left = 16
          top = 32
          width = 121
          height = 21
          itemheight = 13
          taborder = 0
          text = 'circle'
          onchange = combobox3change
          items.strings = (
            'none'
            'circle'
            'rectangle'
            'diamond')
        end
        object checkbox6: tcheckbox
          left = 16
          top = 80
          width = 97
          height = 17
          caption = '连线'
          checked = true
          state = cbchecked
          taborder = 1
          onclick = checkbox6click
        end
        object button6: tbutton
          left = 16
          top = 152
          width = 75
          height = 25
          caption = '笔颜色...'
          taborder = 2
          onclick = button6click
        end
      end
    end
  end
  object chart2: tchart
    left = 472
    top = 0
    width = 472
    height = 426
    bottomwall.gradient.endcolor = 14285190
    bottomwall.gradient.midcolor = clsilver
    bottomwall.gradient.startcolor = 1415426
    bottomwall.gradient.visible = true
    gradient.endcolor = 14285190
    gradient.midcolor = clsilver
    gradient.startcolor = 1415426
    gradient.visible = true
    leftwall.gradient.endcolor = 14285190
    leftwall.gradient.midcolor = clsilver
    leftwall.gradient.startcolor = 1415426
    leftwall.gradient.visible = true
    legend.checkboxes = true
    legend.visible = false
    title.text.strings = (
      '光标同步演示')
    chart3dpercent = 35
    align = alleft
    bevelinner = bvlowered
    bevelwidth = 2
    taborder = 3
    onmousemove = chart2mousemove
    object series3: tlineseries
      cursor = crhandpoint
      marks.callout.brush.color = clblack
      marks.visible = false
      linepen.color = clred
      linepen.width = 2
      pointer.inflatemargins = true
      pointer.style = psrectangle
      pointer.visible = false
      xvalues.name = 'x'
      xvalues.order = loascending
      yvalues.name = 'y'
      yvalues.order = lonone
    end
    object series4: tlineseries
      active = false
      marks.callout.brush.color = clblack
      marks.visible = false
      linepen.color = clgreen
      linepen.width = 2
      pointer.inflatemargins = true
      pointer.style = psrectangle
      pointer.visible = false
      xvalues.name = 'x'
      xvalues.order = loascending
      yvalues.name = 'y'
      yvalues.order = lonone
    end
    object charttool3: tcursortool
      pen.width = 2
      series = series3
      onchange = charttool3change
    end
    object charttool4: tdragpointtool
      series = series3
      ondragpoint = charttool4dragpoint
    end
    object charttool6: tdragmarkstool
    end
    object charttool7: tmarkstiptool
      mousedelay = 250
    end
    object charttool10: textralegendtool
      legend.customposition = true
      legend.left = 0
      legend.legendstyle = lsvalues
      legend.resizechart = false
      legend.top = 0
      series = series4
    end
    object charttool11: tnearesttool
      brush.color = clwhite
      brush.style = bsclear
      pen.color = clwhite
      pen.style = psdot
      series = series3
    end
  end
  object colordialog1: tcolordialog
    left = 532
    top = 228
  end
end
功能代码:
unit unit1;
interface
uses
windows, messages, sysutils, variants, classes, graphics, controls, forms,
dialogs, stdctrls, spin, extctrls, grids, teechartgrid, comctrls,
teetools, teeextralegendtool, teedragpoint, teengine, series, teeprocs,
chart;
type
tform1 = class(tform)
chart1: tchart;
series1: tlineseries;
series2: tlineseries;
charttool2: tdragpointtool;
charttool5: tdragmarkstool;
charttool8: tmarkstiptool;
charttool9: textralegendtool;
charttool12: tnearesttool;
panel1: tpanel;
button5: tbutton;
groupbox1: tgroupbox;
checkbox11: tcheckbox;
checkbox12: tcheckbox;
checkbox2: tcheckbox;
checkbox13: tcheckbox;
checkbox14: tcheckbox;
checkbox15: tcheckbox;
checkbox16: tcheckbox;
pagecontrol1: tpagecontrol;
tabsheet1: ttabsheet;
groupbox2: tgroupbox;
label1: tlabel;
button1: tbutton;
button2: tbutton;
button3: tbutton;
button4: tbutton;
checkbox1: tcheckbox;
checkbox5: tcheckbox;
tabsheet2: ttabsheet;
groupbox3: tgroupbox;
label2: tlabel;
combobox1: tcombobox;
chartgrid1: tchartgrid;
tabsheet3: ttabsheet;
groupbox4: tgroupbox;
checkbox3: tcheckbox;
tabsheet4: ttabsheet;
groupbox5: tgroupbox;
label3: tlabel;
label4: tlabel;
radiogroup1: tradiogroup;
spinedit1: tspinedit;
combobox2: tcombobox;
tabsheet5: ttabsheet;
groupbox6: tgroupbox;
checkbox4: tcheckbox;
tabsheet6: ttabsheet;
groupbox7: tgroupbox;
label5: tlabel;
combobox3: tcombobox;
checkbox6: tcheckbox;
button6: tbutton;
chart2: tchart;
series3: tlineseries;
series4: tlineseries;
charttool3: tcursortool;
charttool4: tdragpointtool;
charttool6: tdragmarkstool;
charttool7: tmarkstiptool;
charttool10: textralegendtool;
charttool11: tnearesttool;
colordialog1: tcolordialog;
charttool1: tcursortool;
procedure formcreate(sender: tobject);
procedure button5click(sender: tobject);
procedure button1click(sender: tobject);
procedure checkbox11click(sender: tobject);
procedure checkbox12click(sender: tobject);
procedure combobox1change(sender: tobject);
procedure button2click(sender: tobject);
procedure button3click(sender: tobject);
procedure button4click(sender: tobject);
procedure checkbox1click(sender: tobject);
procedure checkbox5click(sender: tobject);
procedure chart1mousemove(sender: tobject; shift: tshiftstate; x,
y: integer);
procedure checkbox13click(sender: tobject);
procedure checkbox3click(sender: tobject);
procedure checkbox14click(sender: tobject);
procedure radiogroup1click(sender: tobject);
procedure spinedit1change(sender: tobject);
procedure combobox2change(sender: tobject);
procedure checkbox2click(sender: tobject);
procedure checkbox15click(sender: tobject);
procedure checkbox4click(sender: tobject);
procedure checkbox16click(sender: tobject);
procedure combobox3change(sender: tobject);
procedure checkbox6click(sender: tobject);
procedure button6click(sender: tobject);
procedure charttool2dragpoint(sender: tdragpointtool; index: integer);
procedure charttool4dragpoint(sender: tdragpointtool; index: integer);
procedure charttool1change(sender: tcursortool; x, y: integer;
const xvalue, yvalue: double; series: tchartseries;
valueindex: integer);
procedure charttool3change(sender: tcursortool; x, y: integer;
const xvalue, yvalue: double; series: tchartseries;
valueindex: integer);
procedure chart2mousemove(sender: tobject; shift: tshiftstate; x,
y: integer);
private
{ private declarations }
public
{ public declarations }
end;
var
form1: tform1;
implementation
{$r *.dfm}
procedure tform1.formcreate(sender: tobject);
var
i: integer;
begin
position := poscreencenter;
borderstyle := bsdialog;
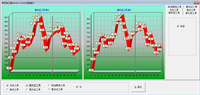
caption := '序列类工具(series tools)功能演示';
charttool1.active := false;
charttool3.active := false;
charttool2.active := false;
charttool4.active := false;
charttool5.active := false;
charttool6.active := false;
charttool8.active := false;
charttool7.active := false;
charttool9.active := false;
charttool10.active := false;
charttool12.active := false;
charttool11.active := false;
series1.fillsamplevalues(40);
series2.fillsamplevalues(40);
for i:=0 to series1.count-1 do
begin
series3.addy(series1.yvalue[i]);
series4.addy(series2.yvalue[i]);
end;
end;
procedure tform1.button5click(sender: tobject);
begin
close;
end;
procedure tform1.button1click(sender: tobject);
begin
charttool1.xvalue := charttool1.xvalue - 1;
charttool3.xvalue := charttool3.xvalue - 1;
end;
procedure tform1.checkbox11click(sender: tobject);
begin
chart1.title.text.text := '光标同步工具演示';
chart2.title.text.text := '光标同步工具演示';
//激活光标工具
charttool1.active := checkbox11.checked;
charttool3.active := checkbox11.checked;
pagecontrol1.activepageindex := 0;
end;
procedure tform1.checkbox12click(sender: tobject);
begin
chart1.title.text.text := '拖点工具演示';
chart2.title.text.text := '拖点工具演示';
charttool2.active := checkbox12.checked;
charttool4.active := checkbox12.checked;
charttool2.series := series1;
charttool4.series := series3;
charttool2.dragstyle := dsy;
charttool4.dragstyle := dsy;
pagecontrol1.activepageindex := 1;
end;
procedure tform1.combobox1change(sender: tobject);
begin
//
case combobox1.itemindex of
0:
begin
charttool2.dragstyle := dsx;
charttool4.dragstyle := dsx;
end;
1:
begin
charttool2.dragstyle := dsy;
charttool4.dragstyle := dsy;
end;
2:
begin
charttool2.dragstyle := dsboth;
charttool4.dragstyle := dsboth;
end;
end;
end;
procedure tform1.button2click(sender: tobject);
begin
charttool1.xvalue := charttool1.xvalue + 1;
charttool3.xvalue := charttool3.xvalue + 1;
end;
procedure tform1.button3click(sender: tobject);
begin
charttool1.yvalue := charttool1.yvalue + 10;
charttool3.yvalue := charttool3.yvalue + 10;
end;
procedure tform1.button4click(sender: tobject);
begin
charttool1.yvalue := charttool1.yvalue - 10;
charttool3.yvalue := charttool3.yvalue - 10;
end;
procedure tform1.checkbox1click(sender: tobject);
begin
charttool1.followmouse := checkbox1.checked;
charttool3.followmouse := checkbox1.checked;
button1.enabled := not checkbox1.checked;
button2.enabled := not checkbox1.checked;
button3.enabled := not checkbox1.checked;
button4.enabled := not checkbox1.checked;
end;
procedure tform1.checkbox5click(sender: tobject);
begin
charttool1.followmouse := checkbox5.checked;
charttool3.followmouse := checkbox5.checked;
end;
procedure tform1.chart1mousemove(sender: tobject; shift: tshiftstate; x,
y: integer);
begin
label1.caption := inttostr(x)+','+inttostr(y);
end;
procedure tform1.checkbox13click(sender: tobject);
begin
chart1.title.text.text := '拖标签工具演示';
chart2.title.text.text := '拖标签工具演示';
charttool5.active := checkbox13.checked;
charttool6.active := checkbox13.checked;
series1.marks.visible := checkbox13.checked;
series3.marks.visible := checkbox13.checked;
checkbox3.checked := checkbox13.checked;
pagecontrol1.activepageindex := 2;
end;
procedure tform1.checkbox3click(sender: tobject);
begin
series1.marks.visible := checkbox3.checked;
series3.marks.visible := checkbox3.checked;
end;
procedure tform1.checkbox14click(sender: tobject);
begin
chart1.title.text.text := '提示签工具演示';
chart2.title.text.text := '提示签工具演示';
charttool8.active := checkbox4.checked;
charttool7.active := checkbox4.checked;
pagecontrol1.activepageindex := 3;
end;
procedure tform1.radiogroup1click(sender: tobject);
begin
case radiogroup1.itemindex of
0:
begin
charttool8.mouseaction := mtmmove;
charttool7.mouseaction := mtmmove;
end;
1:
begin
charttool8.mouseaction := mtmclick;
charttool7.mouseaction := mtmclick;
end;
end;
end;
procedure tform1.spinedit1change(sender: tobject);
begin
charttool8.mousedelay := spinedit1.value;
charttool7.mousedelay := spinedit1.value;
end;
procedure tform1.combobox2change(sender: tobject);
begin
case combobox2.itemindex of
0:charttool7.style :=smsvalue; { 1234 }
1:charttool7.style :=smspercent; { 12 % }
2:charttool7.style :=smslabel; { cars }
3:charttool7.style :=smslabelpercent; { cars 12 % }
4:charttool7.style := smslabelvalue; { cars 1234 }
5:charttool7.style := smslegend; { (legend.style) }
6:charttool7.style := smspercenttotal; { 12 % of 1234 }
7:charttool7.style := smslabelpercenttotal; { cars 12 % of 1234 }
8:charttool7.style := smsxvalue; { 1..2..3.. or 21/6/1996 }
9:charttool7.style := smsxy; { 123 456 }
end;
case combobox2.itemindex of
0:charttool8.style :=smsvalue; { 1234 }
1:charttool8.style :=smspercent; { 12 % }
2:charttool8.style :=smslabel; { cars }
3:charttool8.style :=smslabelpercent; { cars 12 % }
4:charttool8.style := smslabelvalue; { cars 1234 }
5:charttool8.style := smslegend; { (legend.style) }
6:charttool8.style := smspercenttotal; { 12 % of 1234 }
7:charttool8.style := smslabelpercenttotal; { cars 12 % of 1234 }
8:charttool8.style := smsxvalue; { 1..2..3.. or 21/6/1996 }
9:charttool8.style := smsxy; { 123 456 }
end;
end;
procedure tform1.checkbox2click(sender: tobject);
begin
//
chart1.view3d := checkbox2.checked;
chart2.view3d := checkbox2.checked;
end;
procedure tform1.checkbox15click(sender: tobject);
begin
chart1.title.text.text := '附加图例演示';
chart2.title.text.text := '附加图例演示';
charttool9.active := checkbox15.checked;
charttool10.active := checkbox15.checked;
pagecontrol1.activepageindex := 4;
end;
procedure tform1.checkbox4click(sender: tobject);
begin
chart1.legend.visible := checkbox4.checked;
chart2.legend.visible := checkbox4.checked;
end;
procedure tform1.checkbox16click(sender: tobject);
begin
chart1.title.text.text := '最近点工具演示';
chart2.title.text.text := '最近点工具演示';
charttool12.active := checkbox16.checked;
charttool11.active := checkbox16.checked;
pagecontrol1.activepageindex := 5;
end;
procedure tform1.combobox3change(sender: tobject);
begin
charttool11.style := tnearesttoolstyle(combobox3.itemindex);
charttool12.style := tnearesttoolstyle(combobox3.itemindex);
end;
procedure tform1.checkbox6click(sender: tobject);
begin
charttool11.drawline :=checkbox6.checked;
charttool12.drawline :=checkbox6.checked;
end;
procedure tform1.button6click(sender: tobject);
begin
if colordialog1.execute then
begin
charttool11.linepen.color := colordialog1.color;
charttool12.linepen.color := colordialog1.color;
charttool11.pen.color := colordialog1.color;
charttool12.pen.color := colordialog1.color;
end;
end;
procedure tform1.charttool2dragpoint(sender: tdragpointtool;
index: integer);
begin
//拖点同步
charttool4.series.yvalue[index] := charttool2.series.yvalue[index];
charttool4.series.xvalue[index] := charttool2.series.xvalue[index];
end;
procedure tform1.charttool4dragpoint(sender: tdragpointtool;
index: integer);
begin
charttool2.series.yvalue[index] := charttool4.series.yvalue[index];
charttool2.series.xvalue[index] := charttool4.series.xvalue[index];
end;
procedure tform1.charttool1change(sender: tcursortool; x, y: integer;
const xvalue, yvalue: double; series: tchartseries; valueindex: integer);
begin
if checkbox1.checked then
begin
charttool3.xvalue := xvalue;
charttool3.yvalue := yvalue;
end;
end;
procedure tform1.charttool3change(sender: tcursortool; x, y: integer;
const xvalue, yvalue: double; series: tchartseries; valueindex: integer);
begin
if checkbox1.checked then
begin
charttool1.yvalue := yvalue;
charttool1.xvalue := xvalue;
end;
end;
procedure tform1.chart2mousemove(sender: tobject; shift: tshiftstate; x,
y: integer);
begin
label1.caption := inttostr(x)+','+inttostr(y);
end;
end.
如对本文有疑问, 点击进行留言回复!!

uniGUI之自定义JS事件动作ClientEvents(30)
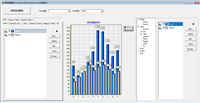

TChart-数据编辑(TChartListBox,TeeCommander)


网友评论