
首先提供两个xml文件
xml代码如下:
1、example.xml
<?xml version="1.0" encoding="iso-8859-1"?>
<chart>
<series title="series1" type="point" color="#ff0000">
<points count="6">
<point index="0" y="339"/>
<point index="1" y="215"/>
<point index="2" y="122"/>
<point index="3" y="237"/>
<point index="4" y="184"/>
<point index="5" y="101"/>
</points>
</series>

<series title="series2" type="point" color="#008000">
<points count="6">
<point index="0" y="356"/>
<point index="1" y="340"/>
<point index="2" y="341"/>
<point index="3" y="352"/>
<point index="4" y="352"/>
<point index="5" y="377"/>
</points>
</series>

<series title="series3" type="point" color="#ffff00">
<points count="6">
<point index="0" y="347"/>
<point index="1" y="345"/>
<point index="2" y="312"/>
<point index="3" y="293"/>
<point index="4" y="283"/>
<point index="5" y="251"/>
</points>
</series>

<series title="series4" type="point" color="#0000ff">
<points count="6">
<point index="0" y="180"/>
<point index="1" y="191"/>
<point index="2" y="200"/>
<point index="3" y="194"/>
<point index="4" y="164"/>
<point index="5" y="131"/>
</points>
</series>

</chart>
2、example1.xml
<?xml version="1.0" encoding="iso-8859-1"?>
<chart>
<series title="series1" type="point" color="#ff0000">
<points count="6">
<point index="0" y="100"/>
<point index="1" y="215"/>
<point index="2" y="122"/>
<point index="3" y="237"/>
<point index="4" y="184"/>
<point index="5" y="101"/>
</points>
</series>

<series title="series2" type="point" color="#008000">
<points count="6">
<point index="6" y="356"/>
<point index="7" y="340"/>
<point index="8" y="341"/>
<point index="9" y="200"/>
<point index="10" y="352"/>
<point index="11" y="377"/>
</points>
</series>

<series title="series3" type="point" color="#ffff00">
<points count="6">
<point index="0" y="347"/>
<point index="1" y="345"/>
<point index="2" y="312"/>
<point index="3" y="293"/>
<point index="4" y="283"/>
<point index="5" y="251"/>
</points>
</series>

<series title="series4" type="point" color="#0000ff">
<points count="6">
<point index="0" y="180"/>
<point index="1" y="191"/>
<point index="2" y="200"/>
<point index="3" y="194"/>
<point index="4" y="164"/>
<point index="5" y="131"/>
</points>
</series>

</chart>
界面代码:
object form1: tform1
left = 524
top = 351
width = 653
height = 432
caption = 'form1'
color = clbtnface
font.charset = default_charset
font.color = clwindowtext
font.height = -11
font.name = 'ms sans serif'
font.style = []
oldcreateorder = false
oncreate = formcreate
pixelsperinch = 96
textheight = 13
object chart1: tchart
left = 0
top = 0
width = 645
height = 353
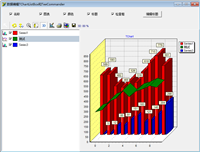
title.text.strings = (
'xml数据源演示(tchart)')
chart3dpercent = 45
align = altop
taborder = 0
printmargins = (
15
22
15
22)
object series1: tbarseries
coloreachpoint = true
marks.callout.brush.color = clblack
marks.visible = true
gradient.direction = gdtopbottom
xvalues.name = 'x'
xvalues.order = loascending
yvalues.name = 'bar'
yvalues.order = lonone
end
object series2: tbarseries
active = false
coloreachpoint = true
marks.callout.brush.color = clblack
marks.visible = true
datasource = teexmlsource3
barstyle = bsrectgradient
gradient.direction = gdtopbottom
xvalues.name = 'x'
xvalues.order = loascending
yvalues.name = 'bar'
yvalues.order = lonone
end
end
object button1: tbutton
left = 104
top = 360
width = 75
height = 25
caption = '&o.打开xml'
taborder = 1
onclick = button1click
end
object button2: tbutton
left = 464
top = 360
width = 75
height = 25
caption = '&e.退出'
taborder = 2
onclick = button2click
end
object teexmlsource1: tteexmlsource
active = true
chart = chart1
filename =
'c:\users\lenovo\desktop\testd7\chartdemo\第二章\7、数据源组件teexmlsource' +
'\example.xml'
series = series1
seriesnode = 'series1'
valuesource = 'y'
end
object teexmlsource3: tteexmlsource
active = true
filename =
'c:\users\lenovo\desktop\testd7\chartdemo\第二章\7、数据源组件teexmlsource' +
'\example1.xml'
series = series2
seriesnode = 'series2'
valuesource = 'y'
end
end
功能代码:
unit unit1;

interface

uses
  windows, messages, sysutils, variants, classes, graphics, controls, forms,
  dialogs, teengine, teeurl, teexml, stdctrls, series, extctrls, teeprocs,
  chart, teeseriestexted;

type
  tform1 = class(tform)
    chart1: tchart;
    series1: tbarseries;
    series2: tbarseries;
    button1: tbutton;
    button2: tbutton;
    teexmlsource1: tteexmlsource;
    teexmlsource3: tteexmlsource;
    procedure formcreate(sender: tobject);
    procedure button2click(sender: tobject);
    procedure button1click(sender: tobject);
  private
    { private declarations }
  public
    { public declarations }
  end;

var
  form1: tform1;

implementation

{$r *.dfm}

procedure tform1.formcreate(sender: tobject);
begin
  position := poscreencenter;
  borderstyle := bsdialog;
end;

procedure tform1.button2click(sender: tobject);
begin
  close;
end;

procedure tform1.button1click(sender: tobject);
begin
  teexmlsource1.chart := chart1;
  teexmlsource1.series := series1;
  teexmlsource1.valuesource := 'y';
  //这里loadfromfile好像没什么用。
//  teexmlsource1.loadfromfile('example1.xml');
  teexmlsource1.filename := 'example1.xml';
  teexmlsource1.active := true;
end;

end.
如对本文有疑问, 点击进行留言回复!!

uniGUI之自定义JS事件动作ClientEvents(30)
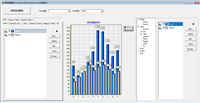

TChart-数据编辑(TChartListBox,TeeCommander)


网友评论