先上图

功能代码:
unit unit1;

interface

uses
  windows, messages, sysutils, variants, classes, graphics, controls, forms,
  dialogs, teengine, series, teenavigator, teechartgrid, grids, stdctrls,
  buttons, extctrls, teeprocs, chart, bubblech, teecomma, teelisb;

type
  tform1 = class(tform)
    panel1: tpanel;
    checkbox1: tcheckbox;
    checkbox2: tcheckbox;
    panel2: tpanel;
    chart1: tchart;
    colordialog1: tcolordialog;
    chartlistbox1: tchartlistbox;
    teecommander1: tteecommander;
    checkbox3: tcheckbox;
    checkbox4: tcheckbox;
    series1: tbarseries;
    series2: tlineseries;
    series3: tbarseries;
    checkbox5: tcheckbox;
    button1: tbutton;
    procedure formcreate(sender: tobject);
    procedure checkbox4click(sender: tobject);
    procedure checkbox2click(sender: tobject);
    procedure checkbox1click(sender: tobject);
    procedure checkbox3click(sender: tobject);
    procedure checkbox5click(sender: tobject);
    procedure button1click(sender: tobject);
  private
    { private declarations }
  public
    { public declarations }
  end;

var
  form1: tform1;

implementation

{$r *.dfm}

procedure tform1.formcreate(sender: tobject);
begin
  //
  series1.fillsamplevalues(10);
  series2.fillsamplevalues(10);
  series3.fillsamplevalues(10);
  position := poscreencenter;
  // teecommander1上的按钮可以自定义选择。
  teecommander1.createcontrols([tcbnormal, tcbseparator,
                        tcbrotate, tcbmove, tcbzoom,
                        tcbdepth, tcb3d, tcbseparator,
                        tcbedit, tcbprintpreview,
                        tcbcopy, tcbsave])

end;

procedure tform1.checkbox4click(sender: tobject);
begin
  if checkbox4.checked then
    chartlistbox1.showseriestitle := true
  else
    chartlistbox1.showseriestitle := false;
end;

procedure tform1.checkbox2click(sender: tobject);
begin
  if checkbox2.checked then
    chartlistbox1.showseriescolor := true
  else
    chartlistbox1.showseriescolor := false;
end;

procedure tform1.checkbox1click(sender: tobject);
begin
  if checkbox1.checked then
    chartlistbox1.showseriesicon := true
  else
    chartlistbox1.showseriesicon := false;
end;

procedure tform1.checkbox3click(sender: tobject);
begin
  if checkbox3.checked then
    chartlistbox1.showactivecheck := true
  else
    chartlistbox1.showactivecheck := false;
end;

procedure tform1.checkbox5click(sender: tobject);
begin
  if checkbox5.checked then
    chartlistbox1.showseriesnames := true
  else
    chartlistbox1.showseriesnames := false;
end;

procedure tform1.button1click(sender: tobject);
begin
  chartlistbox1.showeditor;
end;

end.
界面代码:
object form1: tform1
  left = 435
  top = 280
  width = 802
  height = 612
  caption = '数据编辑tchartlistbox和teecommander'
  color = clbtnface
  font.charset = default_charset
  font.color = clwindowtext
  font.height = -11
  font.name = 'ms sans serif'
  font.style = []
  oldcreateorder = false
  oncreate = formcreate
  pixelsperinch = 96
  textheight = 13
  object panel1: tpanel
    left = 0
    top = 0
    width = 794
    height = 57
    align = altop
    bevelouter = bvnone
    taborder = 0
    object checkbox1: tcheckbox
      left = 152
      top = 20
      width = 97
      height = 17
      caption = '图表'
      checked = true
      ctl3d = true
      parentctl3d = false
      state = cbchecked
      taborder = 0
      onclick = checkbox1click
    end
    object checkbox2: tcheckbox
      left = 248
      top = 20
      width = 97
      height = 17
      caption = '颜色'
      checked = true
      ctl3d = true
      parentctl3d = false
      state = cbchecked
      taborder = 1
      onclick = checkbox2click
    end
    object checkbox3: tcheckbox
      left = 440
      top = 20
      width = 97
      height = 17
      caption = '检查框'
      checked = true
      ctl3d = true
      parentctl3d = false
      state = cbchecked
      taborder = 2
      onclick = checkbox3click
    end
    object checkbox4: tcheckbox
      left = 344
      top = 20
      width = 97
      height = 17
      caption = '标题'
      checked = true
      ctl3d = true
      parentctl3d = false
      state = cbchecked
      taborder = 3
      onclick = checkbox4click
    end
    object checkbox5: tcheckbox
      left = 32
      top = 20
      width = 97
      height = 17
      caption = '名称'
      checked = true
      ctl3d = true
      parentctl3d = false
      state = cbchecked
      taborder = 4
      onclick = checkbox5click
    end
    object button1: tbutton
      left = 568
      top = 16
      width = 75
      height = 25
      caption = '编辑标题'
      taborder = 5
      onclick = button1click
    end
  end
  object panel2: tpanel
    left = 0
    top = 90
    width = 794
    height = 485
    align = alclient
    bevelouter = bvnone
    taborder = 1
    object chart1: tchart
      left = 314
      top = 0
      width = 480
      height = 485
      title.text.strings = (
        'tchart')
      view3doptions.elevation = 315
      view3doptions.horizoffset = 1
      view3doptions.perspective = 0
      view3doptions.rotation = 360
      view3doptions.zoom = 102
      align = alright
      taborder = 0
      printmargins = (
        25
        15
        25
        15)
      object series1: tbarseries
        marks.callout.brush.color = clblack
        marks.visible = true
        barwidthpercent = 75
        gradient.direction = gdtopbottom
        xvalues.name = 'x'
        xvalues.order = loascending
        yvalues.name = 'bar'
        yvalues.order = lonone
      end
      object series2: tlineseries
        marks.callout.brush.color = clblack
        marks.visible = false
        pointer.inflatemargins = true
        pointer.style = psrectangle
        pointer.visible = false
        xvalues.name = 'x'
        xvalues.order = loascending
        yvalues.name = 'y'
        yvalues.order = lonone
      end
      object series3: tbarseries
        marks.callout.brush.color = clblack
        marks.visible = true
        seriescolor = clblue
        barstyle = bscilinder
        gradient.direction = gdtopbottom
        xvalues.name = 'x'
        xvalues.order = loascending
        yvalues.name = 'bar'
        yvalues.order = lonone
      end
    end
    object chartlistbox1: tchartlistbox
      left = 0
      top = 0
      width = 314
      height = 485
      chart = chart1
      align = alclient
      itemheight = 24
      taborder = 1
    end
  end
  object teecommander1: tteecommander
    left = 0
    top = 57
    width = 794
    height = 33
    panel = chart1
    align = altop
    bevelouter = bvnone
    parentshowhint = false
    taborder = 2
  end
  object colordialog1: tcolordialog
    left = 602
    top = 89
  end
end
如对本文有疑问, 点击进行留言回复!!

uniGUI之自定义JS事件动作ClientEvents(30)
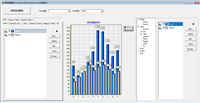

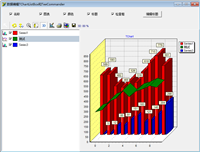
TChart-数据编辑(TChartListBox,TeeCommander)


网友评论