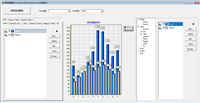
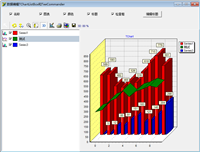
最近不知怎么的,想研究一下图表。先上效果图:

功能代码:
unit unit1;

interface

uses
  windows, messages, sysutils, variants, classes, graphics, controls, forms,
  dialogs, teeedit, extctrls, teeprocs, teengine, series, chart, stdctrls,
  comctrls;

type
  tform1 = class(tform)
    charteditorpanel1: tcharteditorpanel;
    charteditor1: tcharteditor;
    charteditorpanel2: tcharteditorpanel;
    chart1: tchart;
    series1: tbarseries;
    series2: tbarseries;
    button1: tbutton;
    combobox1: tcombobox;
    label1: tlabel;
    combobox2: tcombobox;
    label2: tlabel;
    procedure formcreate(sender: tobject);
    procedure button1click(sender: tobject);
    procedure combobox1change(sender: tobject);
    procedure combobox2change(sender: tobject);
    procedure chart1clickaxis(sender: tcustomchart; axis: tchartaxis;
      button: tmousebutton; shift: tshiftstate; x, y: integer);
    procedure chart1clicklegend(sender: tcustomchart; button: tmousebutton;
      shift: tshiftstate; x, y: integer);
  private
    { private declarations }
  public
    { public declarations }
  end;

var
  form1: tform1;

implementation

{$r *.dfm}

procedure tform1.formcreate(sender: tobject);
begin
  self.position := poscreencenter;
  //右下角图表编辑器树形显示
  charteditorpanel2.editor.tree.visible := true;
  //随机添加10个数
  series1.fillsamplevalues(10);
  series2.fillsamplevalues(10);
end;

procedure tform1.button1click(sender: tobject);
begin
  charteditor1.execute;
end;

procedure tform1.combobox1change(sender: tobject);
var
  pos: ttabposition;
begin
  pos := tptop;
  case combobox1.itemindex of
    0: pos := tptop;
    1: pos := tpbottom;
    2: pos := tpleft;
    3: pos := tpright;
  end;
  charteditorpanel1.editor.tabgeneral.pagecontrol.tabposition := pos;
end;

procedure tform1.combobox2change(sender: tobject);
var
  ts: ttabstyle;
begin
  ts := tstabs;
  case combobox2.itemindex of
    0: ts := tstabs;
    1: ts := tsbuttons;
    2: ts := tsflatbuttons;
  end;
  charteditorpanel1.editor.tabgeneral.pagecontrol.style := ts;
end;

procedure tform1.chart1clickaxis(sender: tcustomchart; axis: tchartaxis;
  button: tmousebutton; shift: tshiftstate; x, y: integer);
begin
  charteditorpanel1.editor.tabaxis.show;
  charteditorpanel1.editor.tabaxis.pagecontrol.activepage.pageindex;
end;

procedure tform1.chart1clicklegend(sender: tcustomchart;
  button: tmousebutton; shift: tshiftstate; x, y: integer);
begin
  charteditorpanel1.editor.tablegend.show;
end;

end.
界面代码:
object form1: tform1
  left = 304
  top = 219
  width = 1312
  height = 679
  caption = '图表编辑器charteditor和charteditorpanel功能演示'
  color = clbtnface
  font.charset = default_charset
  font.color = clwindowtext
  font.height = -11
  font.name = 'ms sans serif'
  font.style = []
  oldcreateorder = false
  oncreate = formcreate
  pixelsperinch = 96
  textheight = 13
  object label1: tlabel
    left = 248
    top = 35
    width = 60
    height = 13
    caption = 'tabs位置:'
  end
  object label2: tlabel
    left = 464
    top = 35
    width = 60
    height = 13
    caption = 'tabs风格:'
  end
  object charteditorpanel1: tcharteditorpanel
    left = 0
    top = 88
    width = 409
    height = 550
    chart = chart1
    taborder = 0
  end
  object charteditorpanel2: tcharteditorpanel
    left = 888
    top = 88
    width = 409
    height = 550
    chart = chart1
    taborder = 1
  end
  object chart1: tchart
    left = 412
    top = 88
    width = 473
    height = 549
    title.text.strings = (
      '图表编辑器测试')
    onclickaxis = chart1clickaxis
    onclicklegend = chart1clicklegend
    taborder = 2
    object series1: tbarseries
      marks.callout.brush.color = clblack
      marks.visible = true
      seriescolor = 16744448
      gradient.direction = gdtopbottom
      xvalues.name = 'x'
      xvalues.order = loascending
      yvalues.name = 'bar'
      yvalues.order = lonone
    end
    object series2: tbarseries
      marks.callout.brush.color = clblack
      marks.visible = true
      seriescolor = clsilver
      gradient.direction = gdtopbottom
      xvalues.name = 'x'
      xvalues.order = loascending
      yvalues.name = 'bar'
      yvalues.order = lonone
    end
  end
  object button1: tbutton
    left = 16
    top = 16
    width = 177
    height = 49
    caption = '调用图表编辑器'
    taborder = 3
    onclick = button1click
  end
  object combobox1: tcombobox
    left = 312
    top = 32
    width = 145
    height = 21
    style = csdropdownlist
    itemheight = 13
    taborder = 4
    onchange = combobox1change
    items.strings = (
      'top'
      'bottom'
      'left'
      'right')
  end
  object combobox2: tcombobox
    left = 528
    top = 32
    width = 145
    height = 21
    style = csdropdownlist
    itemheight = 13
    itemindex = 0
    taborder = 5
    text = 'tabs'
    onchange = combobox2change
    items.strings = (
      'tabs'
      'buttons'
      'flatbuttons')
  end
  object charteditor1: tcharteditor
    chart = chart1
    left = 856
    top = 64
  end
end
如对本文有疑问, 点击进行留言回复!!

uniGUI之自定义JS事件动作ClientEvents(30)

TChart-数据编辑(TChartListBox,TeeCommander)


网友评论